The first thing we did was brainstorm all the appliances and devices that we could think of in the house and yard that used electricity. The family only used electricity so there was no gas to consider, although I guess if I had been thinking we should have looked at petrol usage. The students did an energy audit. They had to tabulate electrical appliances in each room, number of each, kWh and number of hours used each day. They did it on the paper document below.
This was harder than I expected because you cannot find kWh on all the appliances and I was forced to use figures from appliance power consumption website (that I now can't remember). I found it really hard to find numbers for standby power usage and wish I had found the Home Energy Saver website then.
This was harder than I expected because you cannot find kWh on all the appliances and I was forced to use figures from appliance power consumption website (that I now can't remember). I found it really hard to find numbers for standby power usage and wish I had found the Home Energy Saver website then.
| electricity_audit.docx |
We put the data into an Excel Sheet that I obtained from a School Energy Saver Program. This was the first time students had used Excel so I just taught them the use of =SUM and =PRODUCT. The students made a simple spreadsheet with 5 randomly generated numbers from two dice using computers. I entered the data into Energy Audit Cost Calculator below.
| energy_audit_cost_calculator-1.xls |
We analysed our data. What is the biggest user of electricity?
What is the calculated cost of electricity? Is this likely? Where could error have been introduced?
The frustrating thing was that the result we were getting was obviously wrong and I couldn't work out where the error was. So overall this exercise didn't work as well as I wanted it too. However we did learn to use Excel and we did learn about high energy users and that appliances that work 24 hours a day can end up using a lot of electricity.
If I was doing this with a class I think that I would just put the Excel spreadsheet on the IWB and have the students come up with reasonable numbers for appliances and hours of use. After I had added the standby data in advance.
Have a look at Cool Australia's Energy Audit for more ideas.
Have a look at Cool Australia's Energy Audit for more ideas.
Gas Bill Analysis
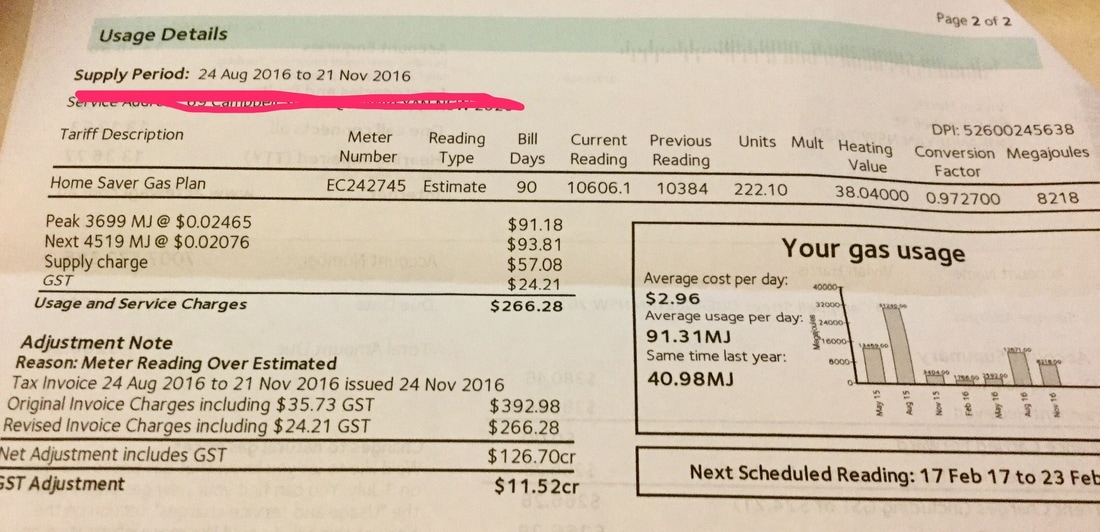
I gave the students photocopies of my gas bill and looked at the time period, gas used =current reading previous reading, graph (why does the amount used change over the year?, why was Aug lower but November higher than last year? Suggestions), cost per day, total cost, supply versus usage charges.
Electricity Bill Analysis
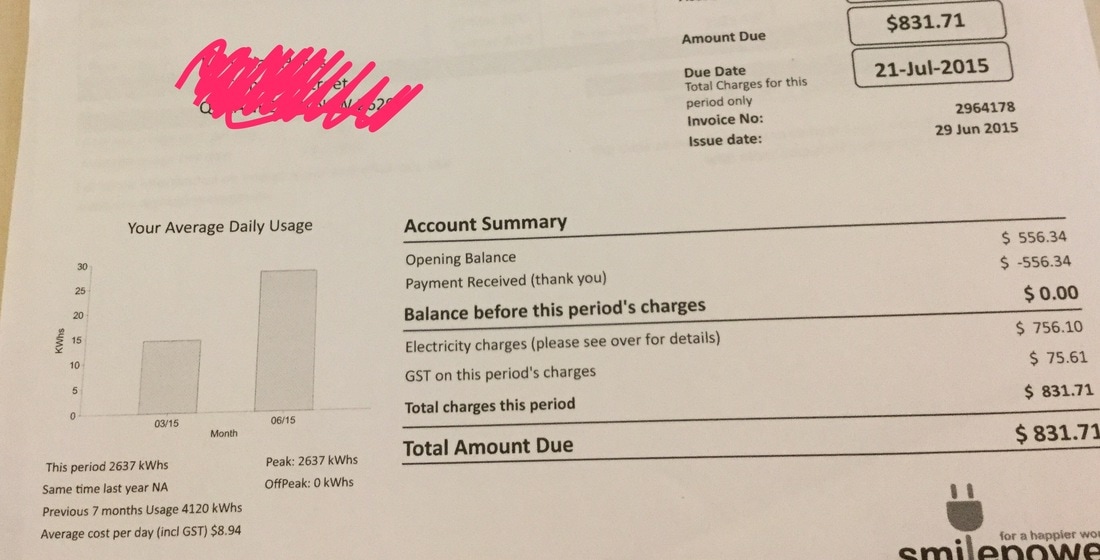
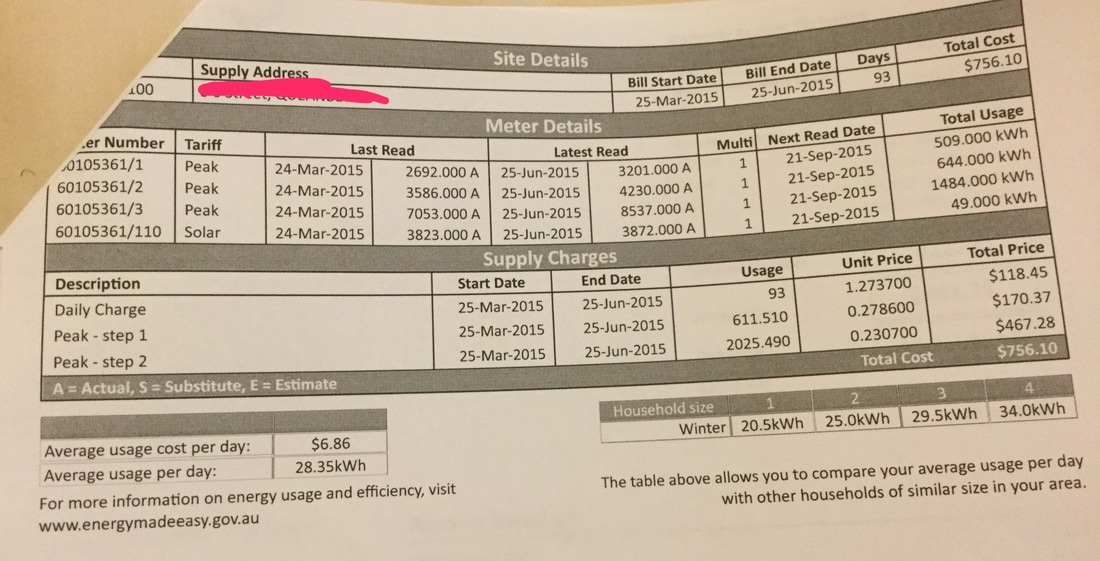
I gave the students photocopies of my electricity bill and we looked at the following features: billing period, total cost, daily cost, average usage, comparison with other households in same region, cost per kWh, connection cost, graph
Overall I was happy with the two lessons we spent on this because we used Sustainability to learn content from Working Mathematically, using digital technologies to solve problems, multiplication, data
 RSS Feed
